The analysis of all the elements that surround digital projects must be carried out with different tools. This process generates results in different formats and levels, making it necessary to create reports that unify and organize the information. The marketing Dashboard of Google Data Studio is one of the most used tools for this purpose. It helps to make the decision-making process more efficient and effective. Businesses can use this Google Marketing Dashboard to track their marketing campaigns, social media metrics, website traffic, etc.
Page Contents
What is Google Data Studio?
Google Data Studio is a reporting tool that allows businesses to visualize their data in the form of charts, graphs, and tables. It also offers the option to create custom reports. This tool is very versatile and can be used for different purposes such as marketing, sales, web analytics, etc.
What is the Marketing Dashboard of Google Data Studio?
The marketing Dashboard of Google Data Studio is a tool businesses can use to track their marketing campaigns, social media metrics, website traffic, and more. This Dashboard can be customized to meet the specific needs of each business. Marketing Dashboard Google Data Studio can be used to track a wide variety of marketing metrics, including:
- Website traffic
- Social media engagement
- Email marketing campaign performance
- Paid advertising campaign performance
- SEO Rankings
How can businesses use the Marketing Dashboard of Google Data Studio?
The marketing Dashboard of Google Data Studio provides businesses with an easy way to track and visualize their marketing data. With the help of Marketing Dashboard Google Data Studio, companies can see how their marketing campaigns are performing, their return on investment, and which channels provide the most ROI. Additionally, the Marketing Dashboard Google Data Studio can also help businesses track their brand awareness and customer engagement levels.
Marketing Dashboard Google Data Studio Features
The ultimate goal of Data Studio is the creation of custom reports and dashboards. However, in order to do high-quality work, you must make use of various functions. Below are the features of Data Studio:
- Easy to use drag and drop interface: Marketing Dashboard Google Data Studio provides an easy to use drag and drop interface that makes it simple to create custom reports and dashboards.
- Connect to multiple data sources: Marketing Dashboard Google Data Studio can connect to various data sources, including Marketing Dashboard Google Analytics, BigQuery, and YouTube.
- Create custom reports and dashboards: With Data Studio, businesses can create custom reports and dashboards that show precisely what they want to see.
- Share reports and dashboards with others: Marketing Dashboard Google Data Studio makes it easy to share reports and dashboards with colleagues, clients, or partners.
- Schedule report email delivery: With Data Studio, businesses can schedule their reports to be emailed to them on a daily, weekly, or monthly basis.
- Export reports to PDF, image, or spreadsheet: Data Studio allows businesses to export their reports to PDF, image, or spreadsheet format.
- Print reports: Businesses can print their reports directly from Data Studio.
- Customize report and dashboard themes: Data Studio provides businesses with the ability to customize the look and feel of their reports and dashboards.
The marketing Dashboard of Google Data Studio can be a precious tool for businesses of all sizes.
Marketing Dashboard Google Data Studio Benefits
When it comes to including new tools in your work environment, you always have to assess whether the time you are going to invest in using its functionalities is worth it compared to the benefits it brings you.
After analyzing its use in different business models, we can assure you that the Marketing Dashboard of Google Data Studio has many advantages in improving marketing strategies and increasing your profits.
So that you can get a more specific idea of what it can help you with, here is a list of its main advantages:
- Data can be entered automatically and manually, achieving unbeatable accuracy.
- The reports can be downloaded in PDF, which is very useful if you need to send a graphical representation of the status of a campaign to a client.
- The presence of default templates and the visual presentation of the contents makes the task of interpreting the data and KPIs much easier and more efficient.
- You can create as many reports as you need and share them with other users.
- The collaboration function is beneficial for teamwork since it allows comments to be made on the reports.
- You can connect Data Studio to various data sources, which will make your work much more efficient.
- The ability to customize the types of graphs, information sources and many other aspects allows you to get the most out of a control panel like this.
Marketing Dashboard Google Data Studio Setup Steps
To setup Marketing Dashboard Google Data Studio, please follow the below steps:
- Connect Data Studio to your data source
- Select a report template or create a blank report
- Configure your report
- Explore and interact with your data
- Share your reports
Now that you know what the marketing Dashboard of Google Data Studio can do for businesses, it’s time to learn how to set it up. Follow the steps below to get started:
1. Connect Data Studio to your data source
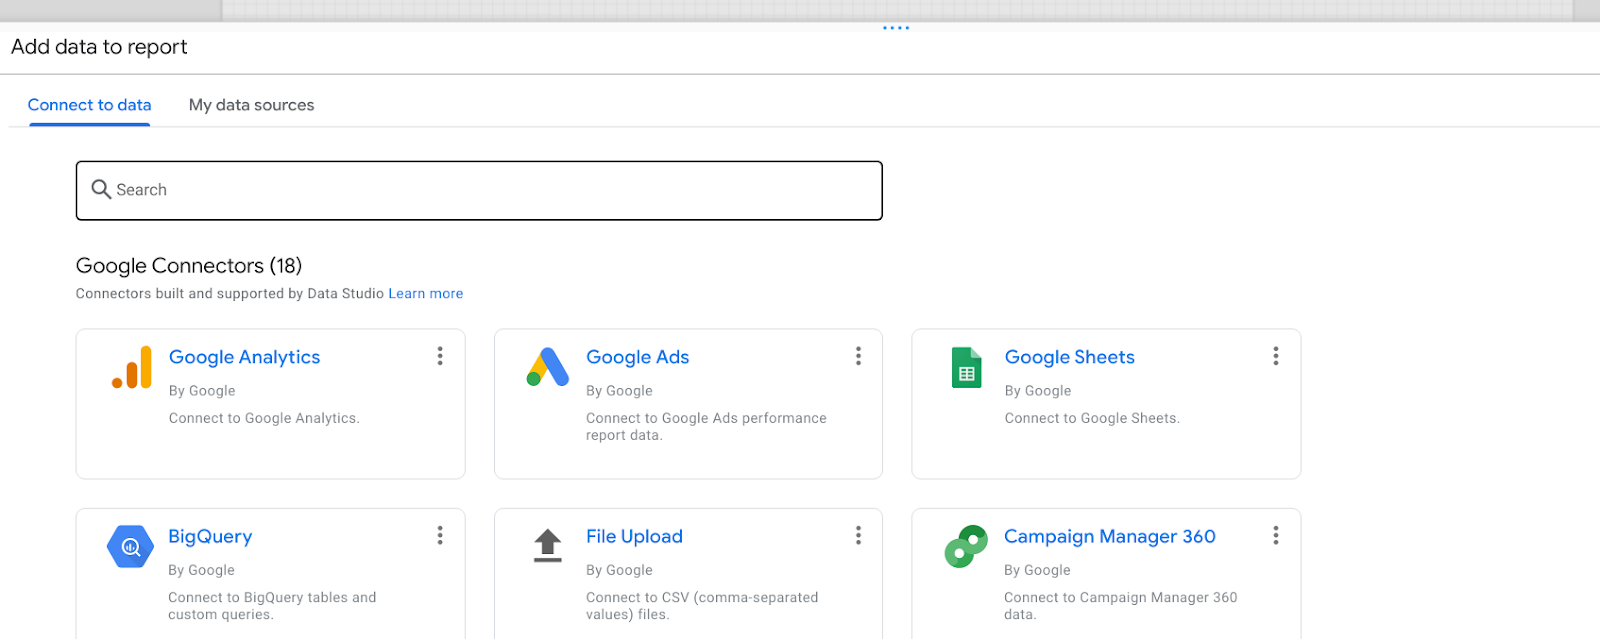
The first step in setting up your marketing Dashboard is to connect Data Studio to your data source. Data Studio can connect to a variety of data sources, including Google Analytics, BigQuery, and MySQL. To learn more about connecting Data Studio to your data source, check out this guide.
2. Select a report template or create a blank report

Once you’ve connected Data Studio to your data source, you can either select a report template or create a blank report. If you’re not sure where to start, we recommend checking out some of the Data Studio Template Gallery report templates.
3. Configure your report

After selecting a report template or creating a blank report, it’s time to configure your pieces of information in it. This involves adding charts and graphs, as well as configuring the data that is displayed in each chart.
4. Explore and interact with your data

Once you’ve configured your report, you can explore and interact with your data. This includes filtering data, drilling down into specific data points, and adding comments.
5. Share your reports

Once you’re happy with your report, you can share it with others by email, link, or embed. To learn more about sharing reports in Data Studio, check out this guide.
Conclusion
Out of all the advantages that the Marketing Dashboard of Google Data Studio offers businesses, one of the most important is its ease of use. The setup process is simple and straightforward, and anyone can learn how to use it effectively with a bit of practice.
If you’re looking for a way to improve your marketing campaigns and increase your profits, we highly recommend giving Data Studio a try.