We are in the technological era where everything is accelerated and runs on data. In this fast-paced competitive market, if you want to make decisions, you will require precise performance indicators to lead your decision to a fruitful result. Since effective marketing is vital for any business, you need to understand how to evaluate your marketing dashboard KPIs. If you are looking for the different factors through which you can reckon your marketing dashboard KPIs, this article is for you.
Page Contents
What is a Marketing KPI dashboard?
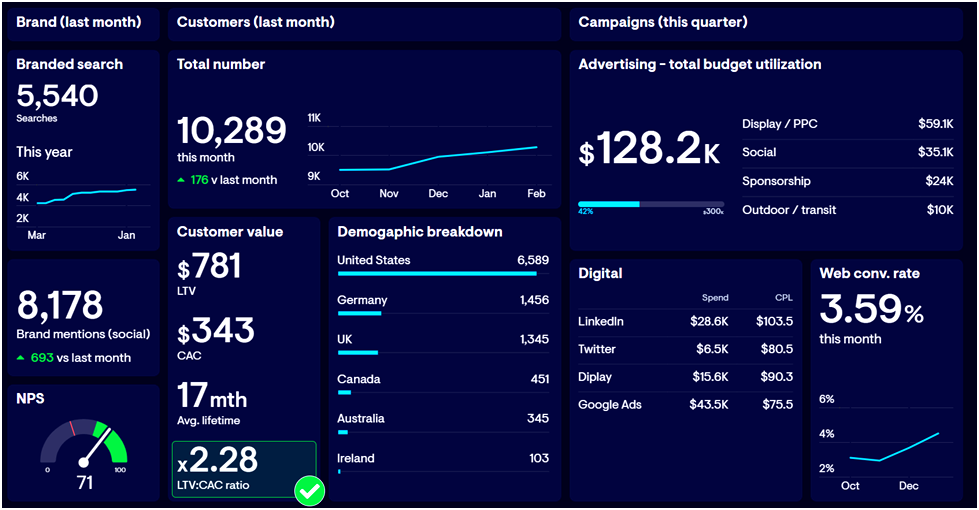
A marketing KPI (Key Performance Indicator) dashboard is an interactive platform that allows digital marketers to bring together marketing-related data and KPIs from multiple sources. Such dashboards have visual and report-driven analytics approaches that help easily track and gauge various marketing metrics. These dashboards show KPIs such as customer retention, conversion rate, marketing ROI, customer lifetime value, sales growth, lead to MQL, organic traffic, bounce rate, etc.
Today, almost all KPI dashboards have features like data visualisation, real-time tracking, multi-level monitoring, and easy report generation.
Why do you need to evaluate your marketing dashboard KPIs?
With the help of a marketing KPI dashboard, you can enable your marketing team and executive heads to communicate with the different types of data. Accumulating the exact marketing KPI values will help you understand your target customers, audiences, and take relevant marketing actions, and steps for business growth. A perfect visual dashboard with the right amount of insight can serve your marketing team in seamlessly evaluating various KPIs and making useful decisions and strategies.
When can you report on your marketing campaign performance?
It is a common question that many marketers ask before leveraging a marketing dashboard. One can report the marketing campaign performance throughout the campaign.
Metrics to consider for evaluating marketing dashboard KPIs
To scale your business or identify the areas to improve upon, you need a marketing KPI dashboard that displays different metrics and insights.
Here are some examples of data-driven pointers that most marketing dashboards display to help you evaluate overall the marketing KPIs.
- Lead conversion rates: One of the most effective KPIs that every marketing team and a business looks forward to is the number of leads and their conversion rate. The conversion rate shows how well your campaign or website turns a visitor into a potential consumer and helps your business generate revenue. Such leads get sorted further into different conversion funnels as per customer traction & business requirements.
- Revenue: It is another metric in your marketing dashboard which can help you evaluate your marketing KPI. Revenue is one of the essential KPI features because every business wants to know the profit it has earned and from which sources. It is the most meaningful metric that delivers a forthright indication of where the company’s growth is heading. Based on this KPI insight, business owners and marketing leaders can mould their strategies and marketing tactics.
- Consumer acquisition cost: It is another significant KPI that helps in determining how much costing it takes to gain each customer. It also gives you a precise idea of the various sources (campaigns, social media posts, ads, websites, etc.) from where the business gains consumers and their respective costs. Depending on this KPI, the marketing team can evaluate which sources are the best to leverage and which can provide more customer retention.
- Number of leads: Identifying the number of leads is one of the most common aspects that a marketing professional considers for evaluating the best KPI. It is the reason why a lot of marketing operations work. This marketing KPI gets subdivided into individual marketing channels to determine the exact sources from where these leads came. Also, such segmentation helps the marketing and business operations team to work effectively.
- Lead response time: Another metric that effectively evaluates your marketing dashboard KPI is the insight for lead response time. Lead response time measures the average span a sales rep takes to follow up with a potential lead after identifying it as a lead. This KPI also helps calculate how fast the team responds and how much time they take to set the right foot and start a relationship with the prospective customer.
- Sales growth: It is an important metric to evaluate the KPI effectively. You can calculate it as either a percentage of year-on-year change or via currency. Sales growth becomes an excellent way to gauge KPI for enterprises with a growth mindset. It also displays insights as suggestions to where the business needs to change.
- Leads to MQL ratio: MQLs are potential leads with a greater chance of buying than general or incompetent ones. When your team is looking for marketing qualified leads (in percentage), the leads to MQL ratio is the best KPI to measure. Your expected lead can turn into MQL if they leave their contact information to make the sales team approach them directly.
- Sales closing rate: The sales closing rate is the ratio between the number of deals closed against the total number of quotes issued. Although it is not the direct marketing KPI, it helps effectively evaluate the marketing dashboard KPIs and sales performance of a business. It can mostly correlate with SQLs and MQLs and enable the marketing team to identify how effectively their strategy works.
Essential elements of the marketing dashboard KPI
Here are some of the essential elements a dashboard for marketing KPI should comprise. These are:
- Easy customization: Since every marketing campaign has its purpose, they require different operations. For extracting meaningful KPI & other performance metrics from each marketing campaign, a dashboard needs easy customization abilities.
- Multiple options for data visualisation: A perfect marketing dashboard allows the team to visualise and communicate with various KPIs and performance data through distinct charts and graphical representations. Also, such dashboards cater to different visualisation figures for the same data to better connect with those KPIs.
- Clean user interface: Loads of information reside within a marketing dashboard. Therefore, it is essential to present all KPIs and other performance metrics clearly so that users can easily read and understand all the information. Also, the buttons and GUI interface for generating and handling multiple charts should be easy-to-use.
Conclusion
We hope this article gives you a complete overview of how or on what factors you can evaluate your marketing dashboard KPIs. Some major factors we can consider are lead conversion rates, revenue, consumer acquisition cost, number of leads, lead response time, sales growth, and sales closing rate. Certain essential elements of a dashboard for marketing KPIs are easy customization, data visualisation option, and clean UI.